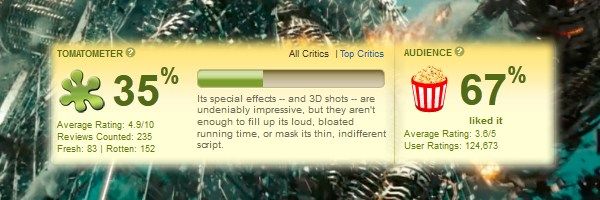
It is common to argue that there is a divide between critics and audiences. Critics prefer arthouse dramas, preferably in black-and-white; audiences like things that go boom. Thanks to countless explosions and few positive reviews, the Transformers sequels became a lightning rod for this argument. Compare the 35s of Transformers: Dark of the Moon: 35% on Rotten Tomatoes, $350 million at the domestic box office. Later in the year, a critical darling like Warrior (83% on RT) managed just over $13 million. Is this the general pattern, or are these exceptions to the rule?For the latest entry of Cinemath, I crunched the numbers to answer this very question. Thankfully the answer is that good movies statistically do better at the box office. After the jump, I try to quantify this effect with an equation that predicts box office using the Rotten Tomatoes score, budget, theater count, plus whether the movie is a sequel and/or rated PG-13.
Background
I gathered data on the 2011 box office for this year-end report, so it was easy enough to do a preliminary check of whether reviews were relevant in 2011. This scatterplot graphs the domestic box office gross against the Rotten Tomatoes score for all the wide releases in 2011.
It looks like a blob of dots until you graph the trend line, which has a noticeably positive slope of about 0.68. This is too simplistic, not considering other factors that contribute to box office, but gives you a good idea of where we are headed.
To incorporate other factors, I developed a linear regression model. The result is an equation with the variable we want to predict (box office gross) on one side, and the input variables (e.g. RT score) on the other side. With regression analysis, you should test out many different factors to identify which are statistically significant to identify which yield the best model. I ultimately landed on these five:
- RT – The Rotten Tomatoes critics score on a scale from 0-100. While not a perfect measure, it is a nice quantitative representation of the critical reception to a movie. I also tested using the IMDB rating or just the “Top Critics†RT score as the critical reception variable. The “All Critics†RT score is a better predictor than both the IMDB rating the “Top Critics†score, so I used the former.
- Budget – The listed production budget in millions of dollars. I am always skeptical about publicly available budgets. Studios have no reason to be forthcoming about what they actually spend on a movie, and so aren’t. These numbers also don’t include the marketing budget for a film, which should have a direct impact on the box office. But the public numbers do give you a sense of scale. For instance, Transformers 3 ($195) cost a lot more to make and market than Warrior ($25 million). Until studios are willing to let me look at their books (please?), this will have to do.
- Theaters – The theater count at widest release. This is simple economics. The wider the release, the greater the accessibility to the audience, both in terms of geography and available showtimes.
-
Sequel – A binary variable that indicates whether or not the movie is a sequel. Sequels are typically the continuation of a previously successful brand, and so have an intuitive advantage at the box office.
- PG13 – A binary variable that indicates whether or not the movie is rated PG-13. This is the optimal rating for demographic variety. There is no age restriction on who can see the movie, but the rating also signals the intention to attract older audiences.
I evaluated other factors, like the month of release, the studio in charge, and whether it was animated. Ultimately, the above five factors lead to the best model that is also relatively explainable.
Results
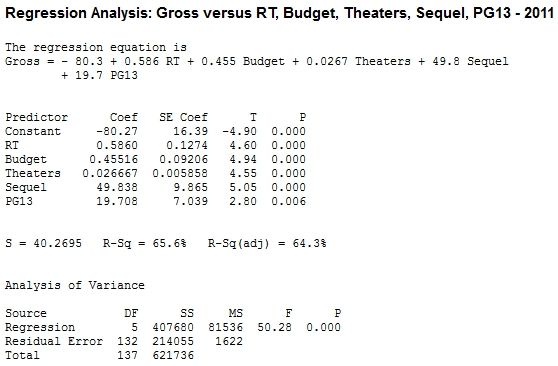
The regression analysis was conducted in Minitab using the 2011 wide releases. There were 143 movies that screened in at least 600 theaters; this analysis is limited to the movies for which I could find a budget. The goal was to find an equation that would predict total domestic box office gross. I rounded the calculations for cleaner numbers, which resulted in this equation:
Gross = –80 + 0.6×RT + 0.5×Budget + 0.025×Theaters + 50×Sequel + 20×PG13
The R2 value is used to measure how good a regression model is. (In statistics, this is bluntly referred to as goodness of fit.) The scale of R2ranges from 0 to 1, where 0 means a bad fit that doesn’t explain any of the variation in the data and 1 means a good fit that perfectly explains all of the variation in the data. For the 2011 data, the R2 for this model is 0.65. There is no strict rule about what makes a good R2. But given the limitation on the data I was able to collect (all publicly available sources) and the complicated process of making and releasing and marketing a movie, I did not expect to achieve an R2 greater than 0.5 with just five variables. So I consider this a good fit.
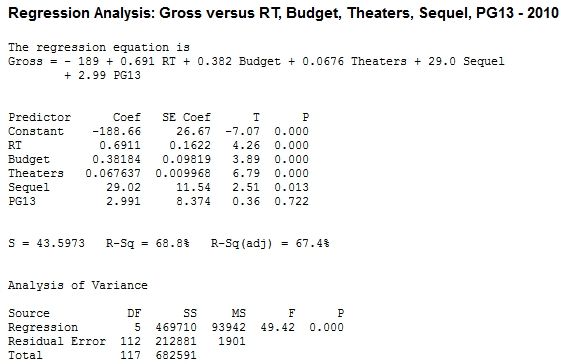
I tested this model on the 2010 wide releases for validation. Even though the 2010 data was not incorporated into the model formulation, the R2is 0.61 when applied to the 2010 data. This suggests that the model is not unique to 2011, and may be valid for predicting box office grosses going forward.
(Disclaimer: for this next part of the analysis to be valid, you need to satisfy certain assumptions that this model does not satisfy. I explain in more detail in the appendix, which is meant more for stats nerds than movie fans. These numbers are intended more as a guideline than an exact numerical calculation, and should be taken with a grain of salt.)
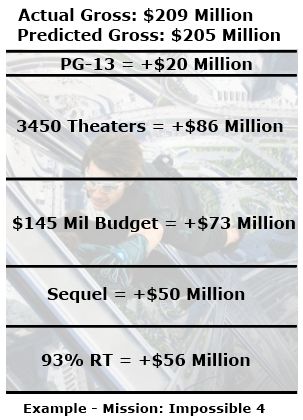
The coefficient in front of each variable represents how much you would expect the gross to increase with a one-unit increase in the predictor variable. For example, the 0.6 in front of RT suggests that every percentage point of the RT score corresponds to about $0.6 million in domestic box office gross. Here is the full breakdown, illustrated by how it works for Mission Impossible - Ghost Protocol on the right:
- An extra 10% on RT is worth about $6 million at the box office.
- An increase of $1 million in budget is worth about $0.5 million at the domestic box office. At first, that looks like a loss. But keep in mind that this does not include international box office, DVD sales, or ancillary revenue.
- An increase of 1,000 theaters is worth about $25 million at the box office.
- Sequels are predicted to earn about $50 million more at the box office.
- A PG-13 movie is predicted to earn about $25 million more at the box office.
These calculations aren’t exact. For instance, the equation predicts Dylan Dog would make –$24.5 million, when it actually grossed $1.2 million (basically the numerically possible equivalent). And the model isn’t really equipped to handle the megahits, totally underestimating the likes of Harry Potter and the Deathly Hallows, Transformers 3, Twilight: Breaking Dawn, and The Hangover 2. That may mean I am missing an important factor or need to tweak the model. On the other hand, those could just be outliers that can’t be predicted using basic data analysis. As a counterexample, the model would have been ready for the surprise success of Rise of the Planet of the Apes, predicting $178.6 million for the PG-13, critic-approved sequel that ultimately grossed $176.8 million.
Conclusion
I do need to stress again that the exact numbers here are not gospel, but give you a general idea of what matters at the box office. I went into this with the research question, “Do moviegoers care if a movie is good?†The answer appears to be yes, with a high correlation between positive reviews and financial success. There is some causation here, where a critic or a friend recommends the movie, and as a direct result someone goes to see that movie. There is also just correlation---critics tend to enjoy the same movies that the general public likes, despite Transform-ed anecdotal evidence to the contrary. Regardless, the bottom line is encouraging: studios have financial incentive to put an effort into making good movies. Ideally, the product will be both good and marketable. And sure, budget, rating, brand awareness, release timing are all important, too. But “good†has value on its own. For movie lovers, that is a beautiful thing.
---
All data comes from the The Numbers, Box Office Mojo, and Rotten Tomatoes.
If you are a stats nerd, head to the appendix on page 2 for the detailed output. Otherwise, meet me in the comments for anything you want to discuss.
In case you found this page first, click here to read the first page of this article.
Appendix
This section is mostly going to be an information dump that will only be of interest to the 1% of the population that uses Minitab and/or R. (Hey, anyone want to teach me SAS?) I add a bit more commentary, and wanted to include this section to support the analysis. But the heavy lifting of the interpretation is left to you.
First, here is the Minitab output for both the 2011 and 2010 data sets. Notice that there is a higher coefficient for RT and a higher R2Â when the regression model is based on the 2010 dataset.
-
---
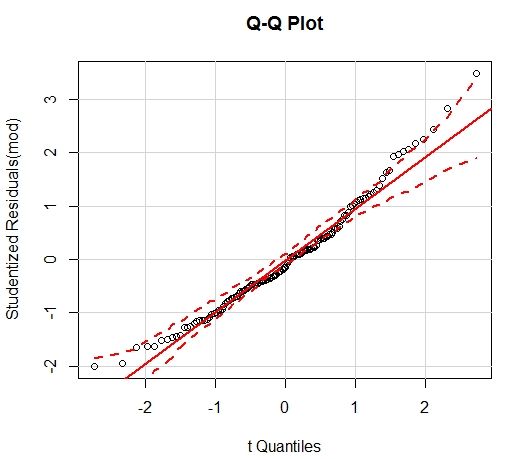
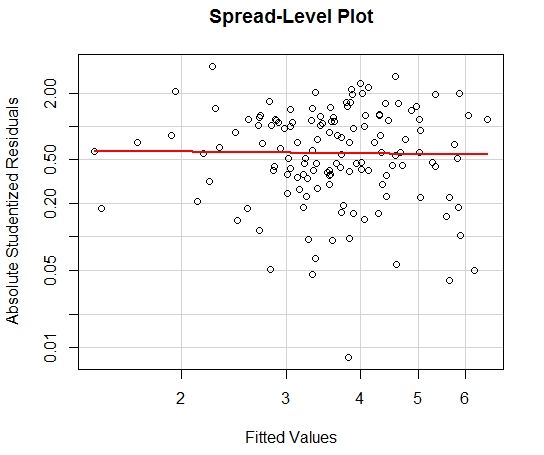
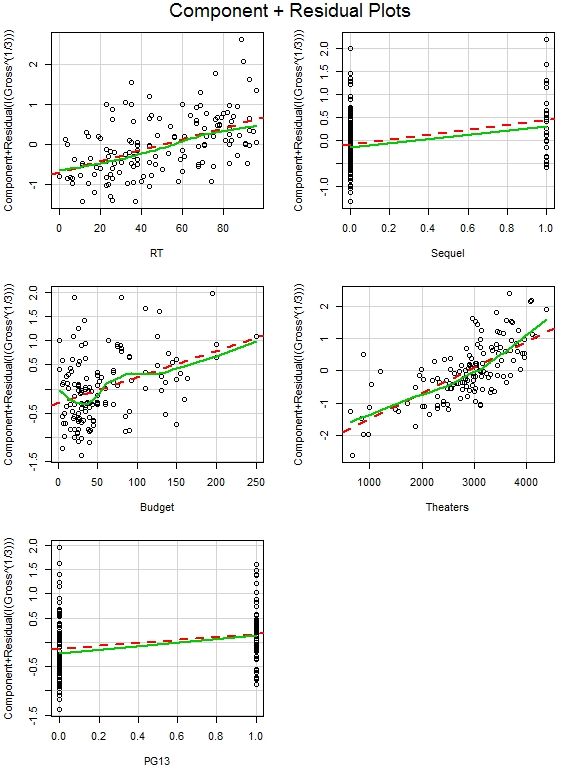
Of course, these models don’t satisfy the necessary assumptions. There is no multicollinearity, and there is sufficient linearity. But the normality assumption is probably violated and there is definite heteroscedasticity.
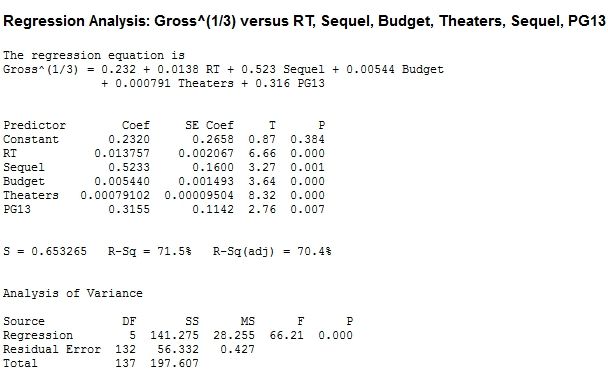
To counteract this, a transformation of the dependent variable Y^(1/3) is needed. This transformation yields a better fit, but the transformation is much harder to explain than a one-unit increase on both sides of the equation, so I stuck with the basic regression model on the first page. There is some benefit to using polynomial regression, especially with the theater count. But since this model is a good fit without raising anything else to a power, I left it at this.
The Minitab output and relevant plots for the transformed regression model follows.

