I know it's 2012 and you're ready to look forward to the new year. But if you can spare a few more minutes to look at 2011, I have a few things to show you about the yearly box office. What it lacks in timeliness, it makes up for in comprehensiveness. That's the Cinemath way!I looked at the domestic and international grosses of the wide releases of 2011 with a few questions in mind: Which movies had greater appeal overseas? Which genres were the most profitable? Which releases had “legs,” and kept audiences coming back week after week? After the jump, I break down the past year in box office every which way I can think of: by total gross, staying power, budget, studio, release date, genre, and MPAA rating. From Abduction ($28 million) to Zookeeper ($80 million):We are looking at the 143 movies that were released in 2011 and played in at least 500 theaters at some point during their run. All grosses are given in millions.The box office totals are updated through Thursday January 6, 2012. This gives most of the releases at least 2 full weeks in release, though some December efforts like Mission: Impossible - Ghost Protocol, The Girl with the Dragon Tattoo, and War Horse are still in theaters making money. All data comes from Box Office Mojo and The Numbers.
Domestic Grosses
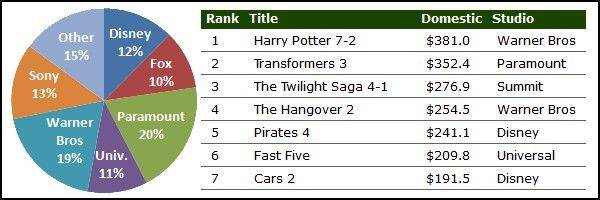
30 movies grossed at least $100 million at the domestic box office in 2011. Well, technically, Gnomeo and Juliet grossed $99,967,670. But since I rounded to the nearest tenth, and I'm a sucker for round numbers: 30.
|
Rank |
Title |
Domestic |
Studio |
|---|---|---|---|
|
1 |
Harry Potter 7-2 |
$381.0 |
Warner Bros |
|
2 |
Transformers 3 |
$352.4 |
Paramount |
|
3 |
The Twilight Saga 4-1 |
$276.9 |
Summit |
|
4 |
The Hangover 2 |
$254.5 |
Warner Bros |
|
5 |
Pirates 4 |
$241.1 |
Disney |
|
6 |
Fast Five |
$209.8 |
Universal |
|
7 |
Cars 2 |
$191.5 |
Disney |
|
8 |
Thor |
$181.0 |
Paramount |
|
9 |
Rise of the Apes |
$176.8 |
Fox |
|
10 |
Captain America |
$176.7 |
Paramount |
|
11 |
The Help |
$169.5 |
Disney |
|
12 |
Bridesmaids |
$169.1 |
Universal |
|
13 |
Kung Fu Panda 2 |
$165.2 |
Paramount |
|
14 |
Mission: Impossible 4 |
$149.7 |
Paramount |
|
15 |
X-Men: First Class |
$146.4 |
Fox |
|
16 |
Puss in Boots |
$146.0 |
Paramount |
|
17 |
Rio |
$143.6 |
Fox |
|
18 |
Sherlock Holmes 2 |
$143.4 |
Warner Bros |
|
19 |
The Smurfs |
$142.6 |
Sony |
|
20 |
Super 8 |
$127.0 |
Paramount |
|
21 |
Rango |
$123.5 |
Paramount |
|
22 |
Horrible Bosses |
$117.5 |
Warner Bros |
|
23 |
Green Lantern |
$116.6 |
Warner Bros |
|
24 |
Hop |
$108.1 |
Warner Bros |
|
25 |
Paranormal Activity 3 |
$104.0 |
Paramount |
|
26 |
Just Go With It |
$103.0 |
Sony |
|
27 |
Alvin & the Chipmunks 3 |
$102.1 |
Fox |
|
28 |
Bad Teacher |
$100.3 |
Sony |
|
29 |
Cowboys & Aliens |
$100.2 |
Universal |
|
30 |
Gnomeo & Juliet |
$100.0 |
Disney |
Paramount released 9 movies to $100+ million, mostly thanks to their superheroes (Thor, Captain America) and animation (Kung Fu Panda 2, Puss in Boots, and Rango). Warner Bros. was second with 5 movies. For the first time since 2006, the year's top grosser earned less than $400 million. Harry Potter and the Deathly Hallows - Part 2 didn't exactly underperform, though, as you'll see in the next section.Amazingly, 8 movies in the top 10 are sequels or, in the case of Rise of the Planet of the Apes, a prequel. Mission: Impossible - Ghost Protocol is poised to knock Captain America out of the top 10, too, which would leave Thor alone to represent the originals. Sherlock Holmes: A Game of Shadows could also end up in the top 10 by the end of its run. Likewise, The Girl with the Dragon Tattoo has a shot at $100 million before it leaves theaters.
International Grosses
16 movies grossed at least $200 million at international box offices in 2011. Three totaled over $1 billion worldwide---this is the first year we've had more than two.
|
Rank |
Title |
International |
Domestic |
Worldwide |
|---|---|---|---|---|
|
1 |
Harry Potter 7-2 |
$947.1 |
$381.0 |
$1328.1 |
|
2 |
Pirates 4 |
$802.8 |
$241.1 |
$1043.9 |
|
3 |
Transformers 3 |
$771.4 |
$352.4 |
$1123.8 |
|
4 |
Kung Fu Panda 2 |
$500.4 |
$165.2 |
$665.6 |
|
5 |
The Smurfs |
$419.9 |
$142.6 |
$562.5 |
|
6 |
Fast Five |
$416.3 |
$209.8 |
$626.1 |
|
7 |
The Twilight Saga 4-1 |
$381.0 |
$276.9 |
$657.9 |
|
8 |
Cars 2 |
$368.4 |
$191.5 |
$559.9 |
|
9 |
Rio |
$341.0 |
$143.6 |
$484.6 |
|
10 |
The Hangover 2 |
$327.0 |
$254.5 |
$581.5 |
|
11 |
Rise of the Apes |
$304.5 |
$176.8 |
$481.3 |
|
12 |
Puss in Boots |
$272.2 |
$146.0 |
$418.2 |
|
13 |
Thor |
$268.3 |
$181.0 |
$449.3 |
|
14 |
The Adventures of Tintin |
$260.5 |
$55.3 |
$315.8 |
|
15 |
Mission: Impossible 4 |
$221.3 |
$149.7 |
$371.0 |
|
16 |
X-Men: First Class |
$207.2 |
$146.4 |
$353.6 |
|
Title |
%Int. |
%Dom. |
International |
Domestic |
|---|---|---|---|---|
|
Johnny English Reborn |
94.8% |
5.2% |
$150.3 |
$8.3 |
|
The Way Back |
86.7% |
13.3% |
$17.6 |
$2.7 |
|
The Three Musketeers |
84.6% |
15.4% |
$111.9 |
$20.4 |
|
The Adventures of Tintin |
82.5% |
17.5% |
$260.5 |
$55.3 |
|
Sanctum |
78.6% |
21.4% |
$85.4 |
$23.2 |
|
Pirates 4 |
76.9% |
23.1% |
$802.8 |
$241.1 |
|
One Day |
75.3% |
24.7% |
$42.3 |
$13.8 |
|
Kung Fu Panda 2 |
75.2% |
24.8% |
$500.4 |
$165.2 |
|
The Smurfs |
74.6% |
25.4% |
$419.9 |
$142.6 |
|
Dylan Dog |
74.1% |
25.9% |
$3.4 |
$1.2 |
|
Final Destination 5 |
73% |
27% |
$115.3 |
$42.6 |
|
Season of the Witch |
72.9% |
27.1% |
$66.8 |
$24.8 |
|
In Time |
72.2% |
27.8% |
$96.5 |
$37.1 |
|
Harry Potter 7-2 |
71.3% |
28.7% |
$947.1 |
$381 |
|
Rio |
70.4% |
29.6% |
$341 |
$143.6 |
|
Title |
%Int. |
%Dom. |
International |
Domestic |
|---|---|---|---|---|
|
Johnny English Reborn |
94.80% |
05.20% |
$150.30 |
$8.30 |
|
The Way Back |
86.70% |
13.30% |
$17.60 |
$2.70 |
|
The Three Musketeers |
84.60% |
15.40% |
$111.90 |
$20.40 |
|
The Adventures of Tintin |
82.50% |
17.50% |
$260.50 |
$55.30 |
|
Sanctum |
78.60% |
21.40% |
$85.40 |
$23.20 |
|
Pirates 4 |
76.90% |
23.10% |
$802.80 |
$241.10 |
|
One Day |
75.30% |
24.70% |
$42.30 |
$13.80 |
|
Kung Fu Panda 2 |
75.20% |
24.80% |
$500.40 |
$165.20 |
|
The Smurfs |
74.60% |
25.40% |
$419.90 |
$142.60 |
|
Dylan Dog |
74.10% |
25.90% |
$03.40 |
$1.20 |
|
Final Destination 5 |
73.00% |
27.00% |
$115.30 |
$42.60 |
|
Season of the Witch |
72.90% |
27.10% |
$66.80 |
$24.80 |
|
In Time |
72.20% |
27.80% |
$96.50 |
$37.10 |
|
Harry Potter 7-2 |
71.30% |
28.70% |
$947.10 |
$381.00 |
|
Rio |
70.40% |
29.60% |
$341.00 |
$143.60 |
A spectacular international gross puts the final chapter Harry Potter series right behind Avatar and Titanic at #3 on the all-time worldwide box office. Harry Potter and the Deathly Hallows - Part 2 was one of 15 movies that earned more than 15% of its total gross overseas.
We Americans had no used for Johnny English Reborn, but the rest of the world loved the spy spoof sequel. The comedy grossed $32 million in its UK home for a very impressive $150 million international total. The Three Musketeers, The Adventures of Tintin, Sanctum, and (relatively speaking) Pirates of the Caribbean: On Stranger Tides underperformed stateside, but were saved by popularity abroad.
Performance After Opening Weekend
I am always interested in which movies have "legs" and perform well after the first weekend. To evaluate this, we look at the multiple, which is the total domestic gross divided by the opening weekend gross. To keep the comparison homogeneous, the multiple was only calculated for the 125 movies that opened on a Friday.
|
Rank |
Title |
Domestic |
Opening |
Date |
|---|---|---|---|---|
|
1 |
Bridesmaids |
$169.1 |
$26.2 |
5/13 |
|
2 |
We Bought a Zoo |
$48.1 |
$09.4 |
12/23 |
|
3 |
Crazy, Stupid, Love |
$84.4 |
$19.1 |
7/29 |
|
4 |
The Lincoln Lawyer |
$58.0 |
$13.2 |
3/18 |
|
5 |
Alvin & the Chipmunks 3 |
$102.1 |
$23.2 |
12/16 |
|
6 |
Puss in Boots |
$146.0 |
$34.1 |
10/28 |
|
7 |
Limitless |
$79.2 |
$18.9 |
3/18 |
|
8 |
Horrible Bosses |
$117.5 |
$28.3 |
7/8 |
|
9 |
Soul Surfer |
$43.9 |
$10.6 |
4/8 |
|
10 |
Insidious |
$54.0 |
$13.3 |
4/1 |
|
11 |
50/50 |
$35.0 |
$08.6 |
9/30 |
|
12 |
Zookeeper |
$80.4 |
$20.1 |
7/8 |
|
13 |
The Smurfs |
$142.6 |
$35.6 |
7/29 |
|
14 |
Gnomeo and Juliet |
$100.0 |
$25.4 |
2/11 |
|
15 |
The Ides of March |
$40.9 |
$10.5 |
10/7 |
Bridesmaids is a word-of-mouth superstar. When I looked at this last year, there was no multiple above a 5. Yet there Bridesmaids is, grossing more than 6 times its solid $26 million opening. The Help definitely had legs, but it opened on a Wednesday, so it's hard to compare exact numbers.
By my count, 7 of these could be considered family films. I tried to find a common thread among the rest, but "targeted toward adults" is not an especially strong link.
At the other end of the spectrum, take a look at the one weekend wonders, movies that made most of their money upfront.
|
Rank |
Title |
Multiple |
Domestic |
Opening |
Date |
|---|---|---|---|---|---|
|
125 |
Creature |
1.6 |
$0.5 |
$0.3 |
9/9 |
|
124 |
Dylan Dog |
1.6 |
$1.2 |
$0.8 |
4/29 |
|
123 |
Bucky Larson |
1.8 |
$2.5 |
$1.4 |
9/9 |
|
122 |
Sucker Punch |
1.9 |
$36.4 |
$19.1 |
3/25 |
|
121 |
Priest |
1.9 |
$29.1 |
$15.0 |
5/13 |
|
120 |
The Mighty Macs |
2.0 |
$1.9 |
$1.0 |
10/21 |
|
119 |
Paranormal Activity 3 |
2.0 |
$104.0 |
$52.6 |
10/21 |
|
118 |
Glee the 3D Concert Movie |
2.0 |
$11.9 |
$6.0 |
8/12 |
|
117 |
The Thing |
2.0 |
$16.9 |
$8.5 |
10/14 |
|
116 |
Take Me Home Tonight |
2.0 |
$6.9 |
$3.5 |
3/4 |
|
115 |
The Twilight Saga 4-1 |
2.0 |
$276.9 |
$138.1 |
11/18 |
|
114 |
Straw Dogs |
2.0 |
$10.3 |
$5.1 |
9/16 |
|
113 |
Apollo 18 |
2.0 |
$17.7 |
$8.7 |
9/2 |
|
112 |
Scream 4 |
2.0 |
$38.2 |
$18.7 |
4/15 |
Creature, Dylan Dog: Dead of Night, and Bucky Larson: Born to Be a Star are all bombs that quickly vacated theaters. However, both Paranormal Activity 3 and The Twilight Saga: Breaking Dawn - Part 1 are notable hits that just happened to make about half their domestic dollars on opening weekend. No shame in that.
Return on Investment
I am skeptical about the production budgets that are listed publicly, especially when advertising costs are not included. But assuming there is some correlation between these budgets and how expensive it is to make and market these movies, it's worth a look to measure performance relative to cost. Big disclaimer: these are budgets that I found online, which are more the number the studio is willing to release rather than the true cost to produce a movie, and does not include marketing costs, which can easily add $40-$100 million to the cost of a big movie. So please do not read too much into the results.
With that in mind, I calculated the return on investment, the net profit (worldwide gross minus budget) divided by the budget.
|
Rank |
Title |
ROI |
Worldwide |
Budget |
|---|---|---|---|---|
|
1 |
Insidious |
63.7 |
$97.0 |
$2 |
|
2 |
Paranormal Activity 3 |
39.6 |
$203.1 |
$5 |
|
3 |
Courageous |
16.0 |
$34.1 |
$2 |
|
4 |
Bad Teacher |
10.4 |
$216.2 |
$19 |
|
5 |
Harry Potter 7-2 |
9.6 |
$1,328.1 |
$125 |
|
6 |
Bridesmaids |
7.9 |
$288.4 |
$33 |
|
7 |
The Help |
7.1 |
$203.0 |
$25 |
|
8 |
Never Say Never |
6.6 |
$98.4 |
$13 |
|
9 |
The Hangover 2 |
6.3 |
$581.5 |
$80 |
|
10 |
Limitless |
5.0 |
$161.8 |
$27 |
|
11 |
Horrible Bosses |
5.0 |
$209.6 |
$35 |
|
12 |
No Strings Attached |
4.9 |
$147.8 |
$25 |
|
13 |
Transformers 3 |
4.8 |
$1,123.8 |
$195 |
|
14 |
Rio |
4.4 |
$484.6 |
$90 |
|
15 |
Jumping the Broom |
4.3 |
$37.3 |
$7 |
|
16 |
Super 8 |
4.2 |
$259.9 |
$50 |
|
17 |
Rise of the Apes |
4.2 |
$481.3 |
$93 |
|
18 |
The Twilight Saga 4-1 |
4.2 |
$657.9 |
$128 |
|
19 |
Apollo 18 |
4.1 |
$25.6 |
$5 |
|
20 |
The Smurfs |
4.1 |
$562.5 |
$110 |
|
21 |
Fast Five |
4.0 |
$626.1 |
$125 |
|
22 |
Our Idiot Brother |
4.0 |
$24.8 |
$5 |
The Paranormal Activity series always shines in this category, but this year Insidious took top honors. Again, that doesn't include marketing costs, but Insidious was definitely very profitable. As was Courageous, continuing the tradition of low-budget indies that appeal to a churchgoing audience. Harry Potter, Transformers, and Twilight prove that you can spend more than $100 million and still muscle your way on to this list.
Deathly Hallows is an interesting case. The reported combined budget for Part 1 and Part 2 is $250 million, so it's valid to split the investment costs between the two parts, even if the investment was higher than reported. Warner Bros. had to market each movie individually, though---given the size of Harry Potter, marketing costs must be massive. It cost much more than $125 million to make that $1.3 billion return, but without knowing the exact numbers, I can guarantee Deathly Hallows made a ton of money theatrically.
Studio Performance
12 different distributors released at least 4 movies in 2011.
|
Studio |
Movies |
Total |
Average |
|---|---|---|---|
|
Paramount |
15 |
$1,834.4 |
$122.3 |
|
Warner Bros |
20 |
$1,763.5 |
$88.2 |
|
Sony |
21 |
$1,232.2 |
$58.7 |
|
Disney |
14 |
$1,160.4 |
$82.9 |
|
Universal |
15 |
$976.6 |
$65.1 |
|
Fox |
15 |
$955.5 |
$63.7 |
|
Summit |
6 |
$413.3 |
$68.9 |
|
Relativity |
6 |
$227.7 |
$37.9 |
|
Lionsgate |
5 |
$174.4 |
$34.9 |
|
Weinstein Co. |
7 |
$148.7 |
$21.2 |
|
FilmDistrict |
4 |
$126.0 |
$31.5 |
|
Focus Features |
4 |
$104.8 |
$26.2 |
We already highlighted Paramount for their 9 movies that grossed $100+ million, so it's no surprise to see them at the top of the list in both total and average gross. Averaging over $120 million per release is impressive, especially since the average of the closest competitor is less than $90 million.
Among the six major studios, Universal and Fox struggled. Meanwhile, Summit rode the Twilight franchise to relevancy in its final year as an independent studio. This is how the market breaks down, with each studio's percentage contribution to the total domestic box office:

Sorted by Month, Genre, and Rating
I like to sort the movies by month of release, genre, and MPAA rating. For each category, the table gives the average of the domestic gross, worldwide gross, multiple, and listed budgets of the corresponding movies.
BY MONTH OF RELEASE
|
Month |
Movies |
Domestic |
Worldwide |
Multiple |
Budget |
|---|---|---|---|---|---|
|
January |
7 |
$43.9 |
$100.6 |
2.7 |
$50.6 |
|
February |
11 |
$51.7 |
$104.9 |
2.8 |
$36.7 |
|
March |
12 |
$52.3 |
$103.8 |
2.9 |
$56.9 |
|
April |
17 |
$53.4 |
$119.0 |
2.9 |
$40.7 |
|
May |
9 |
$130.3 |
$372.2 |
3.2 |
$88.3 |
|
June |
9 |
$124.3 |
$326.3 |
2.8 |
$112.4 |
|
July |
11 |
$111.3 |
$293.8 |
3.3 |
$74.4 |
|
August |
14 |
$48.8 |
$96.7 |
2.8 |
$35.6 |
|
September |
18 |
$32.4 |
$53.9 |
2.8 |
$28.8 |
|
October |
12 |
$44.3 |
$125.1 |
2.7 |
$48.5 |
|
November |
12 |
$72.8 |
$135.0 |
2.7 |
$84.2 |
|
December |
11 |
$65.2 |
$127.8 |
3.9 |
$60.9 |
Unsurprisingly, the summer months yield at least $100 million per movie. Likewise, the 6 most expensive movies were released in May, June, or July; 4 of the top 6 were released in June. That said, I find it curious that only 9 movies opened in May and June.
Since so many December movies are still in theaters, it should become the most lucrative non-summer release month by the end of January.
BY GENRE
|
Genre |
Movies |
Domestic |
Worldwide |
Multiple |
Budget |
|---|---|---|---|---|---|
|
Action |
15 |
$65.7 |
$165.5 |
2.6 |
$69.6 |
|
Animated |
16 |
$96.1 |
$270.7 |
3.4 |
$108.1 |
|
Comedy |
20 |
$59.1 |
$114.1 |
2.9 |
$40.7 |
|
Drama |
13 |
$43.6 |
$61.2 |
3.2 |
$29.3 |
|
Dramedy |
8 |
$33.4 |
$45.0 |
3.2 |
$29.9 |
|
Family |
13 |
$45.3 |
$70.0 |
3.3 |
$40.8 |
|
Horror |
14 |
$31.4 |
$67.8 |
2.3 |
$29.8 |
|
Non-fiction |
3 |
$33.4 |
$44.2 |
2.3 |
$11.0 |
|
Romantic Comedy |
10 |
$46.2 |
$93.3 |
2.9 |
$32.0 |
|
Sci-fi/Fantasy |
17 |
$148.9 |
$413.7 |
2.6 |
$114.9 |
|
Thriller |
14 |
$46.7 |
$92.0 |
3.1 |
$34.9 |
This comes with the disclaimer that I assigned the genres, so it's a loose analysis.
Sci-fi/fantasy is the go-to genre for modern blockbusters, so on average costs the most, but also results in the highest-grossing movies. I have always been confused why animation is so expensive these days---more than $100 per movie. Is it labor costs? Paying all those animators to go through the movie frame by frame. Or is it the visual effects? The electric bill, maybe? Honestly curious, if a commenter has the answer.
As you might expect, the horror genre has the lowest multiple. Action and sci-fi/fantasy are also on the low end. (Non-fiction has too small a sample size to judge the results.) Animated and family films tend to have better legs. This generally matches conventional wisdom.
BY MPAA RATING
|
Rating |
Movies |
Domestic |
Worldwide |
Multiple |
Budget |
|---|---|---|---|---|---|
|
G |
8 |
$75.6 |
$156.1 |
3.1 |
$65.0 |
|
PG |
28 |
$63.9 |
$162.2 |
3.2 |
$70.1 |
|
PG-13 |
63 |
$78.5 |
$189.5 |
2.8 |
$63.3 |
|
R |
44 |
$44.9 |
$85.6 |
2.8 |
$35.1 |
Don't have much to say here---just think the table is interesting on its own. Look, R-rated movies gross less! No NC-17 wide releases!
Man, this is anticlimactic.