
The New York Times Best Seller list is based on the number of books sold. Television ratings report how many people watched the program. Broadway World posts the number of seats sold for each show each week alongside the gross. Hell, you can see how many tickets each movie sold in Japan and France, yet in the domestic market (U.S. and Canada), we only get box office grosses. Box office is a measure of profitability, not popularity. Box office says the New Yorker who buys a $20 ticket for an IMAX 3D showing at the AMC Empire 25 is four times as important as the Illinoisian who buys a $5 ticket for a Sunday matinee at the AMC Mt Vernon 8. Let the accountants worry about revenue—I only care about how many people saw the thing.
Eventually I'd like to find a better way to rank the highest-grossing movies of all time, but this edition of Cinemath will start where most other box office statisticians do: adjust for ticket price inflation. More after the jump.

The adjusted gross is calculated by dividing the total domestic gross by the average ticket price of that release year to estimate the number of tickets sold. That number is multiplied by $8.16, the estimated average ticket price in 2013 to give a rough idea of what every movie made in "2013 dollars."
A few notes on the available data:
- Box Office Mojo posts the domestic box office for virtually every release since 1980. I grabbed the top 100 domestic grosses for every year from 1980-2012.
- Data on international grosses is also limited, and the average ticket price only covers theaters in the United States and Canada, anyway. So we have to stick to domestic box office*.
- Only the first theatrical run is considered—grosses from reissues are omitted.
These restrictions cause a few hiccups when ranking every movie on the all-time charts, but we’ll get to that on page two.
The chart below plots the adjusted gross of every top-grossing movie of the year from 1980-2012. (Note: Javascript must be enabled to view these Google charts. Hover over a data point to see the title and adjusted gross.)
Rain Man has the honor of the lowest adjusted gross on the list at $343 million. Otherwise, most of the movies are between $350 million (Three Men and a Baby) and $692 million (The Phantom Menace). The average is about $550 million. That seems about right. $350 million domestic is a total that would thrill any aspiring blockbuster. Avatar and The Avengers proved it’s possible to break the $600 million barrier in the modern age. Anything above $700 million puts you in the Hall of Fame. That’s Jurassic Park ($703 million), Avatar ($816 million), E.T. ($997 million), and Titanic ($1.1 billion).
There is no noticeable trend in the qualification for top movie of the year over time, but it’s a different story for the other percentiles. The graph below plots the adjusted gross for the movies ranked 10th, 25th, 50th, 75th, and 100th every year.
I expected that adjusting for inflation would flatten the lines—that the threshold for each percentile would stay constant over time. However, all the lines trend up. The threshold for a top 10 movie in the 1980s was $125-$175 million in 2013 dollars. Recent releases need an adjusted gross of at least $200 million to sneak into the top 10. I suspect this is related to the population increase (227 million in 1980, about 310 million in 2012) and theater expansion. The Empire Strikes Back reached less than 1,300 theaters—The Avengers opened in over 4,300 theaters.
In a similar line of analysis, I was very interested in this visualization of movies that earned $100 million. The image below shows the actual (not adjusted) domestic gross for the top 100 from 1980-2012. The movies that grossed $100 million or more are highlighted in green.

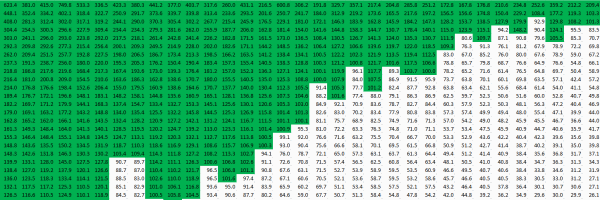
There are many more green cells in recent years, which makes sense given ticket inflation. I expected that once the totals were adjusted for inflation, we would see about the same number of movies cross $100 million in 2013 dollars every year. Nope. The image below shows the adjusted gross for the top 100 from 1980-2012. The movies with an adjusted gross of $100 million or more are highlighted in blue.

I don't have a great hypothesis to explain this trend (challenge to all commenters), but I believe the visual speaks to the variation in the theatrical marketplace over time, which brings us to phase two.
Page 2
*I am trying to file all my features on domestic box office before domestic box office becomes irrelevant. I may already be too late.
Click here to return to page 1
I kept reissue grosses out of the dataset. This ends up restricting the all-time list to modern releases.
Consider Gone with the Wind, which Box Office Mojo crowns the bestselling movie of all time with an estimated adjusted gross over $1.6 billion domestic. Gone with the Wind earned nearly $200 million (not adjusted) over multiple releases and several decades. To put that in perspective, Gone with the Wind earned just $40 million of that $200 million in the first 25 years of release. I don't believe it's valid to compare to the year-plus that Star Wars was in theaters, much less the four-month theatrical run of The Avengers.

In the first run in 1939-1940, Gone with the Wind sold an estimated 25 million tickets. At $8.16 a ticket, that would be about $200 million in 2013 sales, missing the top 100 on the list of adjusted first-run grosses. Even the two-year sales of nearly 50 million tickets (about $400 million in 2013 dollars) misses the top 50.
Or take The Sound of Music, a more recent phenomenon that surpassed Gone with the Wind in 1966 on the all-time domestic charts. The musical grossed $20 million in the first 10 months. Although it seems unlikely that it earned $23 million in the next 2 months, we will take the estimate $43 million as the upper bound for one-year gross. At about $1.01-$1.08 a ticket in 1965-1966, that is at most $350 million in 2013 dollars, a total that keeps Sound of Music out of top 60 on the list of adjusted first-run grosses.
Similar release patterns for other hall-of-famers—The Ten Commandments, Doctor Zhivago, all the early Disney cartoons—muddy the waters. So I’m in a bind. I want to adjust for inflation to strip the influence of rising ticket prices, but to go back too far into the past is to compare apples to oranges.
The too-neat solution to a messy problem: Start with Jaws in 1975, the consensus dawn of the modern era of blockbusters. Jaws was not the first movie to gross $100 million at the domestic box office, but it got there the quickest in just 59 days of release. Jaws still opened on just 464 screens compared to the 4,000+ of today’s widest releases, but given the limited data on the first run vs. reissue grosses for most pre-1980 movies, 1975 is about as far back as we can go and still claim apples to apples.
Box Office Mojo diligently researched the All Time Box Office Adjusted for Ticket Price Inflation chart. I don’t blame you if you prefer their method of including the gross of every release-that list is undoubtedly worth poring over. But here is an alternative list of all 54 movies since 1975 that grossed at least $400 million (in 2013 dollars) in their initial theatrical run. ("Adjusted" is adjusted gross in millions. "Actual" is actual gross in millions. All actual grosses via Box Office Mojo unless otherwise linked.)
|
Rank |
Year |
Title |
Adjusted |
Actual |
|---|---|---|---|---|
|
1 |
1997 |
Titanic |
1068 |
600.8 |
|
2 |
1982 |
E.T.: The Extra-Terrestrial |
997 |
359.2 |
|
3 |
2009 |
Avatar |
816 |
749.8 |
|
4 |
1977 |
Star Wars |
809 |
|
|
5 |
1975 |
Jaws |
764 |
|
|
6 |
1993 |
Jurassic Park |
704 |
357.1 |
|
7 |
1999 |
Star Wars: Episode I - The Phantom Menace |
692 |
431.1 |
|
8 |
1983 |
Return of the Jedi |
654 |
252.6 |
|
9 |
1994 |
Forrest Gump |
644 |
329.7 |
|
10 |
2012 |
Marvel's The Avengers |
639 |
623.4 |
|
11 |
1980 |
The Empire Strikes Back |
635 |
209.4 |
|
12 |
1981 |
Raiders of the Lost Ark |
623 |
212.2 |
|
13 |
1994 |
The Lion King |
611 |
312.9 |
|
14 |
2008 |
The Dark Knight |
606 |
533.3 |
|
15 |
2004 |
Shrek 2 |
580 |
441.2 |
|
16 |
1984 |
Beverly Hills Cop |
570 |
234.8 |
|
17 |
2002 |
Spider-Man |
567 |
403.7 |
|
18 |
1996 |
Independence Day |
565 |
306.2 |
|
19 |
1978 |
Grease |
558 |
160.0 |
|
20 |
1984 |
Ghostbusters |
557 |
229.2 |
|
21 |
1990 |
Home Alone |
551 |
285.8 |
|
22 |
2006 |
Pirates of the Caribbean: Dead Man's Chest |
527 |
423.3 |
|
23 |
1989 |
Batman |
516 |
251.2 |
|
24 |
2003 |
The Lord of the Rings: The Return of the King |
510 |
377.0 |
|
25 |
1982 |
Tootsie |
492 |
177.2 |
|
26 |
2004 |
Spider-Man 2 |
491 |
373.6 |
|
27 |
2004 |
The Passion of the Christ |
487 |
370.3 |
|
28 |
2005 |
Star Wars: Episode III - Revenge of the Sith |
484 |
380.3 |
|
29 |
1985 |
Back to the Future |
484 |
210.6 |
|
30 |
2002 |
The Lord of the Rings: The Two Towers |
477 |
339.8 |
|
31 |
1999 |
The Sixth Sense |
471 |
293.5 |
|
32 |
1978 |
Superman |
468 |
134.2 |
|
33 |
1977 |
Smokey and the Bandit |
464 |
126.7 |
|
34 |
2003 |
Finding Nemo |
460 |
339.7 |
|
35 |
2012 |
The Dark Knight Rises |
459 |
448.1 |
|
36 |
2001 |
Harry Potter and the Sorcerer's Stone |
458 |
317.6 |
|
37 |
2001 |
The Lord of the Rings: Fellowship of the Ring |
452 |
313.4 |
|
38 |
1976 |
Rocky |
449 |
117.2 |
|
39 |
1997 |
Men in Black |
446 |
250.7 |
|
40 |
1996 |
Twister |
446 |
241.7 |
|
41 |
2009 |
Transformers: Revenge of the Fallen |
437 |
402.1 |
|
42 |
1984 |
Indiana Jones and the Temple of Doom |
437 |
179.9 |
|
43 |
1975 |
One Flew Over the Cuckoo's Nest |
434 |
109.0 |
|
44 |
1993 |
Mrs. Doubtfire |
432 |
219.2 |
|
45 |
2010 |
Toy Story 3 |
429 |
415.0 |
|
46 |
1992 |
Aladdin |
427 |
217.4 |
|
47 |
1977 |
Close Encounters |
426 |
116.4 |
|
48 |
2002 |
Star Wars: Episode II - Attack of the Clones |
424 |
302.2 |
|
49 |
1990 |
Ghost |
420 |
217.6 |
|
50 |
1978 |
Animal House |
419 |
120.1 |
|
51 |
2012 |
The Hunger Games |
418 |
408.0 |
|
52 |
2003 |
Pirates of the Caribbean: The Curse of the Black Pearl |
413 |
305.4 |
|
53 |
1997 |
The Lost World: Jurassic Park |
407 |
229.1 |
|
54 |
1989 |
Indiana Jones and the Last Crusade |
405 |
197.2 |
For the sake of charts, here are the actual and adjusted totals for all 54 movies plotted in rank order.
Before you read too much into either this list or Box Office Mojo’s, consider that both are dependent on the accuracy of the average ticket price. The average ticket price is useful for broad analysis (like comparing trends across several thousand movies as on page 1 of this article), but is limited in studies that need more precision (like ranking individual movies on page 2). Box Office Mojo explains the limitations well:
"Since these figures are based on average ticket prices they cannot take into effect other factors that may affect a movie's overall popularity and success. Such factors include but are not limited to: increases or decreases in the population, the total number of movies in the marketplace at a given time, economic conditions that may help or hurt the entertainment industry as a whole (e.g., war), the relative price of a movie ticket to other commodities in a given year, competition with other related medium such as the invention and advancements of Television, VHS, DVD, the Internet, etc."
Perhaps there is a better way to account for such factors. A topic for another Cinemath . . .