I obsessively rate every movie I've ever seen on IMDB. I started doing this when I was about 20 years old, so there are gaps between my memory of my adolescent viewing habits and this list. But the record says I have seen 1,165 feature films, which must account for pretty much all of them. At the very least, it's a lot of data, and I'd like to do something with it for Cinemath, my semi-regular* feature that combines the wonder of movies with the tedium of mathematical analysis.Since the list is stored on IMDB, every movie I rated conveniently has the public rating right next to it. I am curious how often I agree with the public, and lucky for me, there are statistical tools to evaluate exactly that. So after the jump, see how my ratings compare to those of the IMDB voting public, along with a few graphs of my viewing habits.Props to IMDB, who made this a lot easier by allowing lists to be exported into .csv files with your rating, the IMDB average rating, runtime, and number of votes, among other categories. I removed everything I've seen that has under 1,000 votes (sorry, Mongolian Ping Pong), which left 1,157 feature films in the dataset.We'll get to the good stuff soon, but first, indulge me in a look at my viewing habits. The first graph is a histogram that counts the number of films I have seen for every release year since 1920.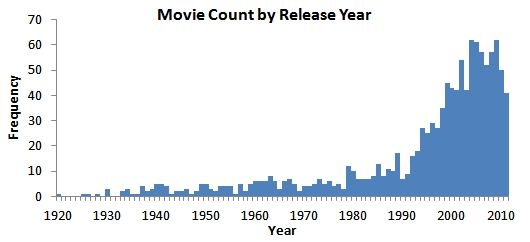 Obviously there is a spike after I was, you know, born. (In 1988, if that helps put 1,165 movies into perspective.) A couple notes:
- I haven't seen more than 8 movies from any given year before 1979.
- My biggest years are 2004 and 2009, each of which yielded 62 movies I have seen.
- I think of 2004 as the movie I officially became a cinephile rather than just an avid moviegoer. I have seen at least 50 movies from every year since 2004.
There are hundreds new releases every year, so there are absolutely gaps in my film knowledge. But I am averaging over 50 movies for every year I've been alive, which seems respectable for a part-time movie blogger.
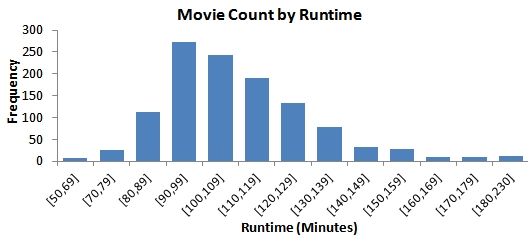
The next graph breaks down the distribution of movies by runtime. (The notation [90,99] means "between 90 and 99 minutes.")
I clearly like that 90-120 minute sweet spot. Longer than an hour-and-a-half, shorter than two hours: over 60% of the movies I watched fall in this range. I believe this is because most movies are between 90-120 minutes, but it's also possible that I have a short attention span.
Now, on to the ratings. For those not familiar with the IMDB ratings system: IMDB allows the user to rate any movie in the database from 1 to 10; the average rating across all IMDB users is given to one decimal point. It is not a perfect system. Wily users find ways to cast multiple votes to sway the rating. Not all users use the 1-10 scale the same way (this will come up later). And I must compare my single-digit ratings (i.e. "7") to ratings with a decimal place (i.e. "7.3"). However, the system in place is just fine for my needs.
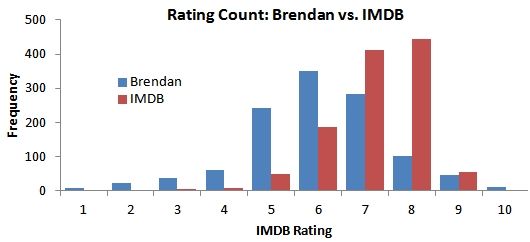
The first graph here is a histogram that compares the number of times I have given out a certain rating to how often that rating is near the IMDB average. For the purposes of the histogram, the IMDB average is rounded, such that everything between 6.5-7.4 is counted under "7."
It is apparent that I consistently rate the movies I have seen lower than the IMDB average. For comparison, my average rating is 6.06; the IMDB average for the same movies is 7.15.
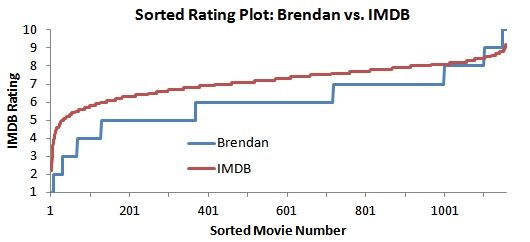
To illustrate this difference further, I created a second graph that sorts the ratings from lowest to highest, and plots the results.
The "Brendan" line is always under the "IMDB" line until the very high ratings. There are a handful of movies that I consider perfect 10s, while IMDB users have were unable to vote anything higher than The Shawshank Redemption and The Godfather, which sit atop the rankings with a 9.2 rating and over 1 million votes combined. But otherwise, my rating pattern is much stricter.
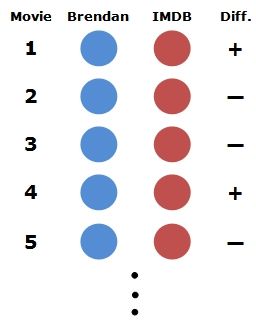
The verdict is in, visually. But to make it official, I called upon the Wilcoxon signed-rank test. Essentially, the Wilcoxon test examines the difference (both sign and magnitude) between my score and the IMDB average for each individual movie, then evaluates whether the two sets of ratings are significantly different on the whole. Indeed, the Wilcoxon test confirms that I rate movies about 1 point lower than the IMDB average. The p-value is a statistical measurement between 0 and 1 that indicates how certain we can be a difference was truly detected. The lower the p-value, the more certain the test. The p-value for this Wilcoxon test was 0.000---so, there is no doubt.
I am not ready to brand myself an elitist, though. So I looked at the numbers from a different perspective. What if the average IMDB user and I feel the exact same about the quality of a movie, yet give it two different ratings because we view the rating system differently?** In other words, what if my "6" is my "7"?
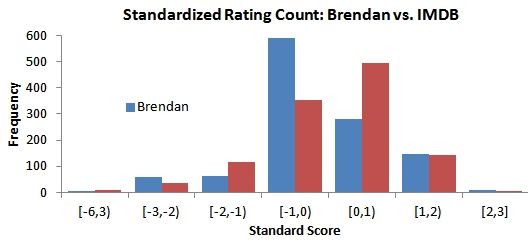
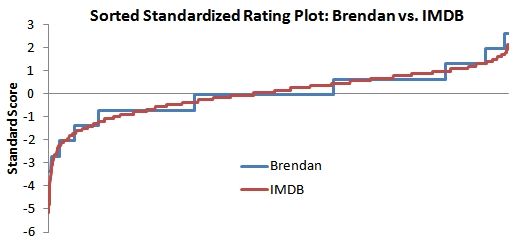
In an attempt to account for this, I looked at the standard score. The standard score scales each rating relative to all the other ratings I have given. The idea is that high positive values are assigned the movies I was crazy about and low negative values are assigned to the movies I hated, without being locked into the arbitrary 1-10 scale. When the IMDB average ratings are also standardized, the standard scores (in theory) allow me to compare on a scale that strips that perspective influence.
You can see the results of the standardization below. The first graph is another histogram that counts movies according the standard score given. The second sorts the standard scores from lowest to highest, and plots the results.
Okay, that's a little better. I still give out more low ratings, but the lines in the second graph indicate a very similar standardized rating pattern. The Wilcoxon test for the standardized data agrees: a p-value of 0.726 means a difference between my ratings and the IMDB average cannot be detected with any certainty.
One caveat: I am not totally sure that the standardization I used is valid for this data. So I probably am an elitist. Damn. Well, at least if I am a movie snob, I have the movie histogram to back up my credentials.
*I was (and will continue to be) careful to say "semi-regular" in the first Cinemath article on the game theory of Snow White, published in May. Emphasis on the "semi," I guess, because I don't know how often I am going to be doing these. The researcher in me needs to focus on healthcare much more often than movies, but holidays are good for Cinemath. In case you'd like to follow along, the next three are probably: 1) A look at the runtimes/ratings of Oscar Best Picture winners, 2) A year-end box office report, 3) A massive analysis on the impact of reviews/quality on box office that I started putting together in September before it swallowed me whole.
-
**This is how I rate:
- 1 --- This movie is reprehensible.
- 2-4 --- I did not like this movie.
- 5 --- This movie was okay, maybe enjoyable at times, but sometimes frustrating.
- 6 --- This movie was enjoyable, but somewhat forgettable.
- 7 --- This movie was enjoyable, and contained at least one standout element.
- 8 --- This movie was great, with many standout elements.
- 9 --- This movie was stellar, nearly flawless.
- 10 --- This is a pantheon movie, one that I have seen many times and will watch many times more.

